The Buddhabrot Part 3: Algorithmic Optimizations
In the last part we learned what the Buddhabrot is and why it’s pretty slow to generate. As a recap, my version of it uses the following values:
- Minimum iteration limit: 1,000,000
- Maximum iteration limit: 5,000,000
- Size: 68,719,476,736 pixels (262,144 x 262,144)
Series Overview
- Part 1 - What is the Mandelbrot set?
- Part 2 - What is the Buddhabrot?
- Part 3 - Algorithmic Optimizations
- Part 4 - Code Optimizations
- Part 5 - The Big Reveal
Algorithmic Optimizations
The real problem is that programmers have spent far too much time worrying about efficiency in the wrong places and at the wrong times; premature optimization is the root of all evil (or at least most of it) in programming.
Before we start throwing code at the problem we’re going to have to put on our thinking caps and try to figure out some ways to reduce the amount of work we’re doing.
Let’s take a look at the Mandelbrot set again:
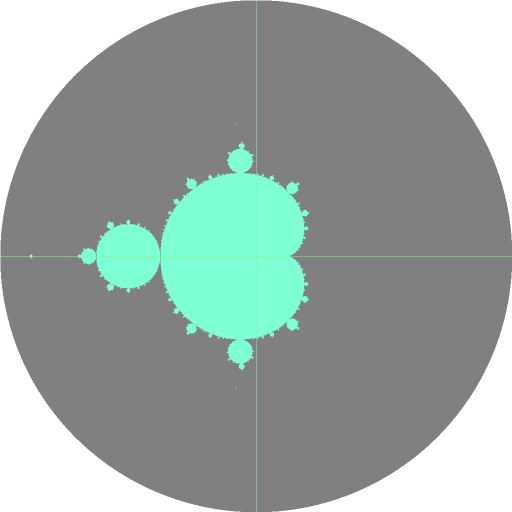
We’re starting by picking random points inside the circle. Since we only care about points that aren’t in the set and our maximum iteration count is pretty high (5 million), picking a point that’s inside the set is obviously very expensive. Remember, those points will never leave the circle even under infinite iteration, so we will always loop for our maximum number before we have to throw away all that work.
Is there some faster way to tell whether a point is in the set?
Main Bulb Check
As it turns out, kind of. The main bulb of the set can be perfectly described by a cardioid, and it’s possible to fit circles inside of all of the smaller bulbs:
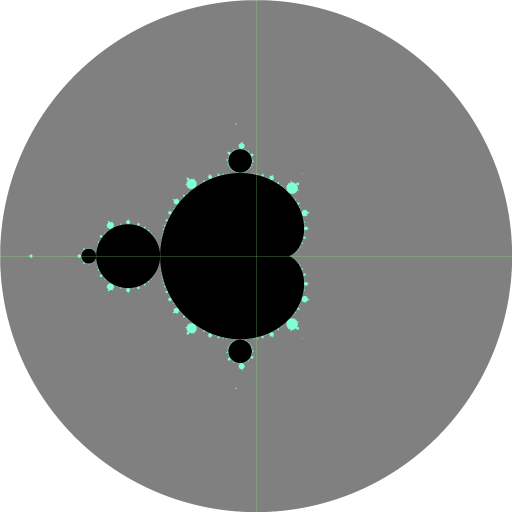
With this optimization, we can easily discard any starting point from those areas with a quick geometric check.
How do you find the equations for those areas? Well, uh, you search the internet. There’s an equation that you can solve to get the position/size for all those circles, but I’m not sure I even know the name of the math class that I didn’t take in college that would have let me solve for those.
Where are the interesting points?
OK, so far, so good - that eliminates a bunch of points we don’t want. Where are the points we do want?
Let’s take another look at the visualization of the escape times:

From this, we can see that the escape time increases as you move closer and closer to the border of the Mandelbrot set. In other words, since we are looking for points that escape between 1 - 5 million iterations, we only need to search in areas that are really close to the edge.
Border Regions
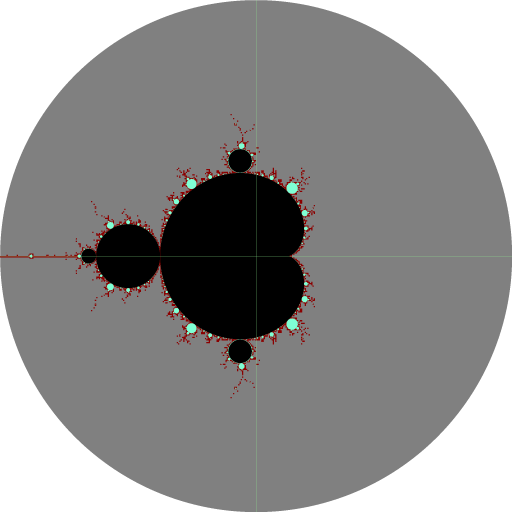
By finding the border areas we can dramatically increase the chances that we pick a point that will match our criteria. Instead of picking a random starting point from the comparatively giant gray circle, we can now limit ourselves to only those areas highlighted in red above. This is by far the most important optimization we can do.
There’s multiple ways of find the border regions, but the algorithm I used isn’t particularly complex:
- Divide up the area into a grid of points.
- Iterate each point to see whether it is inside or outside the set.
- The border regions are going to be the squares where some of the points are in the set and some aren’t:
- If all four corners are not in the set, we assume it’s outside
- If all four corners are in the set, we assume it’s inside
- If the corners are a mix, the region must include part of the border
Yes, there will be regions that the set dips into without covering one of the corners. That will be true no matter what resolution of the grid you choose, however, since the Mandelbrot set has infinite detail.
Any other optimizations?
In our first optimization, we were able to filter out some of the points inside the Mandelbrot set. However, it’s still very possible we’ll run into some of them. What actually happens to the points that are inside the set when you iterate them?
Perhaps unsurprisingly, they will eventually get caught in an infinite loop, generating the same points over and over again.
Cycle Detection
To catch points like that we can use a cycle detection algorithm like Brent’s algorithm. Essentially, it periodically checks the current z value against an older version to see if we’re revisiting older points.
This algorithm felt a bit weird to me when I first saw it because it’s directly comparing floating-point numbers, which is probably the biggest thing you’re never supposed to do with floating-point numbers. Well, this is one of the rare exceptions to the rule. If the z value is ever the exact same binary value as a previous z it will naturally become an infinite loop since the algorithm is deterministic - the same input will always generate the same output.
When I implemented this I had no concept of how much or little it improved the speed. Let’s come back to it later to see if we can answer that…
What optimization aren’t we doing?
Let’s take a look at a plain rendering of the set again:

Can you think of an optimization we haven’t talked about? Hint: it would make things twice as fast…
If you guessed something involving symmetry you are correct. The Mandelbrot set is perfectly symmetrical across the real axis. For the purpose of the Buddhabrot, we could mirror the trajectories we plot and thereby make everything twice as fast. However, since we’re picking random starting points, you lose a bit of visual interest by making the Buddhabrot symmetrical. We’ll revisit this when I talk about the final rendering, but this is one optimization I intentionally skipped.
Summary
We’ve covered some algorithmic means of reducing the amount of work we have to do. In the next installment, we can move on to code optimizations.