The Buddhabrot Part 5: The Big Reveal
I think it’s high time to show off the big version…
Series Overview
- Part 1 - What is the Mandelbrot set?
- Part 2 - What is the Buddhabrot?
- Part 3 - Algorithmic Optimizations
- Part 4 - Code Optimizations
- Part 5 - The Big Reveal
The 68.7 Gigapixel Buddhabrot
Tada! You can pan around and use the mouse wheel to zoom in/out. It should work fine on mobile too.
Thanks to SEP for being willing to host it.
Guided Tour
Let’s examine some features to back up some of the claims I’ve made throughout the series.
The effects of high iteration limits
I stated that using higher minimum/maximum iteration limits made the Buddhabrot “cooler.” This is what I meant:
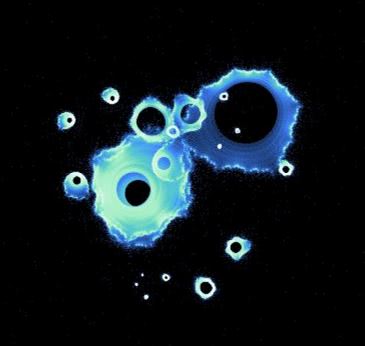
These odd raindrop-shaped objects and the other “swirly” features you’ll see aren’t really visible if you pick lower bounds. I think we are seeing the points swirl around in circles a while before they escape, although I haven’t investigated this further.
Asymmetry
Remember how I intentionally didn’t mirror the output, despite the Mandelbrot set being symmetrical? This is a closeup of the middle “seam” (the line of symmetry runs vertically down the middle) :
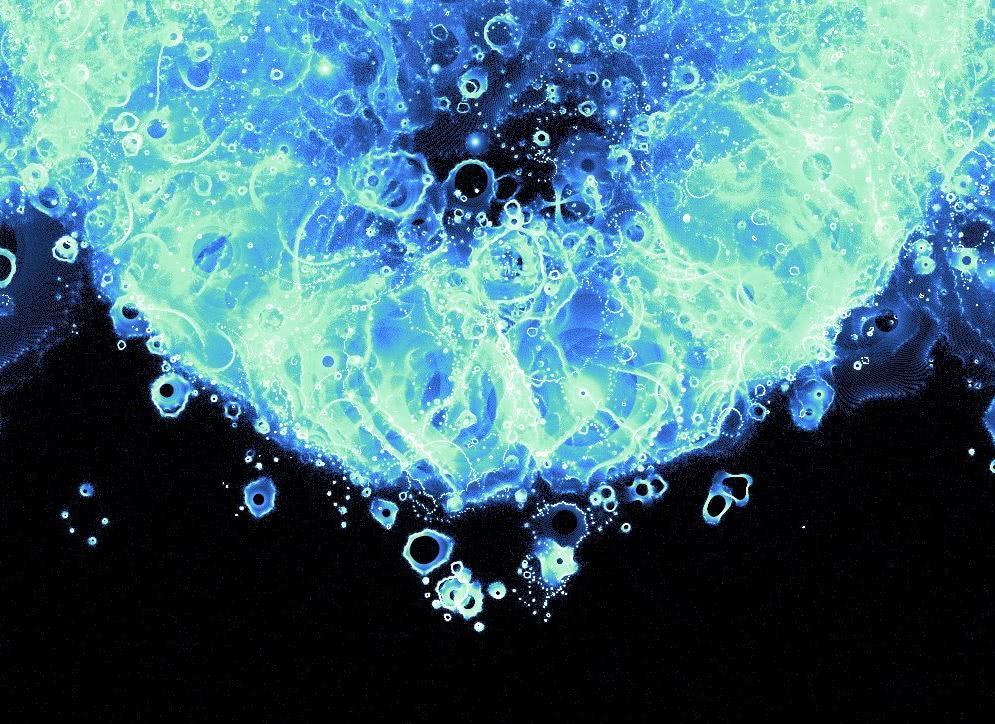
You can see that it’s not quite the same on both sides since we’re ultimately picking random points to plot. If we somehow managed to plot an infinite number of points it would look perfectly symmetrical, however. How many points you should plot is ultimately a subjective decision.
Also, philosophically I don’t like the idea of mirroring it. If I’m going through the trouble of generating gigabytes of images I want them to at least be different!
Shadows
All throughout the Buddhabrot you can see these ghostly shadows fading into nothingness:
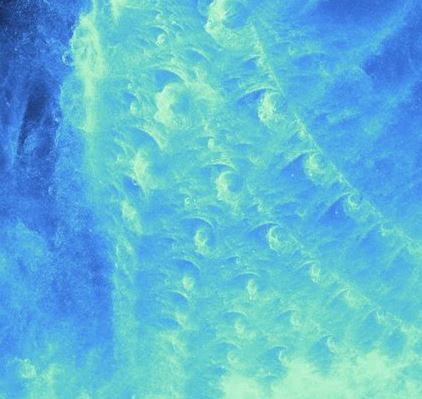
I don’t have much to say about them; I just think it looks cool 😊
The Heart
Towards the top you can see the “heart” of the Buddhabrot:
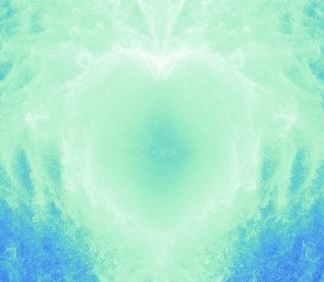
If you scroll up from this point you’ll see smaller and smaller versions of it - there is an infinite number of hearts!
Effects of the number of points
As you explore the Buddhabrot, you’ll come across a lot of smaller, less detailed versions of the whole:
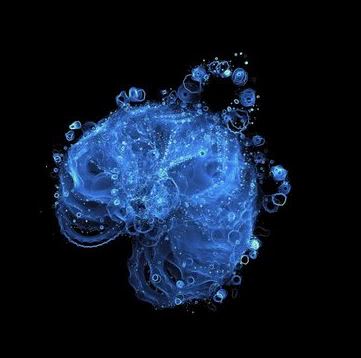
If I had plotted the trajectories of, oh, maybe an order of magnitude more points, some of the these smaller versions would look a whole lot closer to the bigger one. Each of these small copies (even the teeny ones with barely any detail) are exact copies of the whole. If you somehow plotted an infinite number of trajectories at infinite zoom levels, you could keep zooming into these smaller versions and never find the bottom…
Blown-out Regions
Despite my best efforts, there are some areas that just don’t show a lot of detail. This is most notable around the origin:
I’m not sure there really is more detail to show around this area, but it still feels a bit unsatisfying…
The Code
All the code for this can be found on GitHub if you’re curious. I feel like I need a disclaimer here, however… At some point I got pretty sloppy with it (tons of hardcoded things, etc) because the code is really just a means to an end, not the end result. After coming back to it a year later I felt the pain from that because I couldn’t find anything and didn’t remember how to run any of the steps. Just the perils of a mostly solo hobby project, I guess.
What’s Next?
Am I done with the Buddhabrot? A year ago, I would have said “probably.” However, preparing for the talk got me thinking about it again, and there’s still some areas that could be improved…
- GPU computing is by far the lowest hanging fruit. This is something I want to explore more anyway, so it would be a perfect excuse.
- By applying some tone mapping concepts there might be a way to bring out more detail in the output.
- Everyone always, always asks me if I’m going to make a bigger one. A terapixel is a nice round number but you really start getting into some headaches:
- A terapixel version would have around 16 times the image data for… two more zoom levels? Hosting 16GB of JPEGs is one thing; 256GB is quite another.
- The time involved goes up substantially too. For example, the Google Guetzli JPEG encoder can drastically reduce the size of images. However, they warn that it takes around 1 minute of CPU time for 1 megapixel. OK, so 1 terapixel of images would take… 2 years? And, whoops, it’s not just 1 terapixel because that’s only the deepest zoom level - if you count all the images for the other zoom levels it’s over 1.3 terapixels of images.
We’ll see what/if I decide to do…
Conclusion
What I’ve hoped you’ve taken away from this series is:
- Fractals are really neat and the math isn’t terribly scary. I haven’t done much of anything math related since I graduated but even I can figure this stuff out.
- Projects like this are a great way to pick up useful skills. I’ve had to break out some frameworks and solutions that would easily be useful on the job.